

Monti Debug
Full Stack Debugging Solution for Meteor.
Monti Debug helps you to identify what's happening behind your Meteor app including both client and the server code. Based on that information, you can improve the performance of your app and make it faster.
It'll also help you to fix hard to debug UI issues.
Compatible with Meteor 1.6 and newer.
This package is based on kadira:debug.
Getting Started
First add the following package to your app:
1meteor add montiapm:debug
- Then run your app. (Let's assume your app runs on port 3000)
- After that, visit https://app.montiapm.com/debug
- Then connect to
http://localhost:3000from the Monti Debug UI
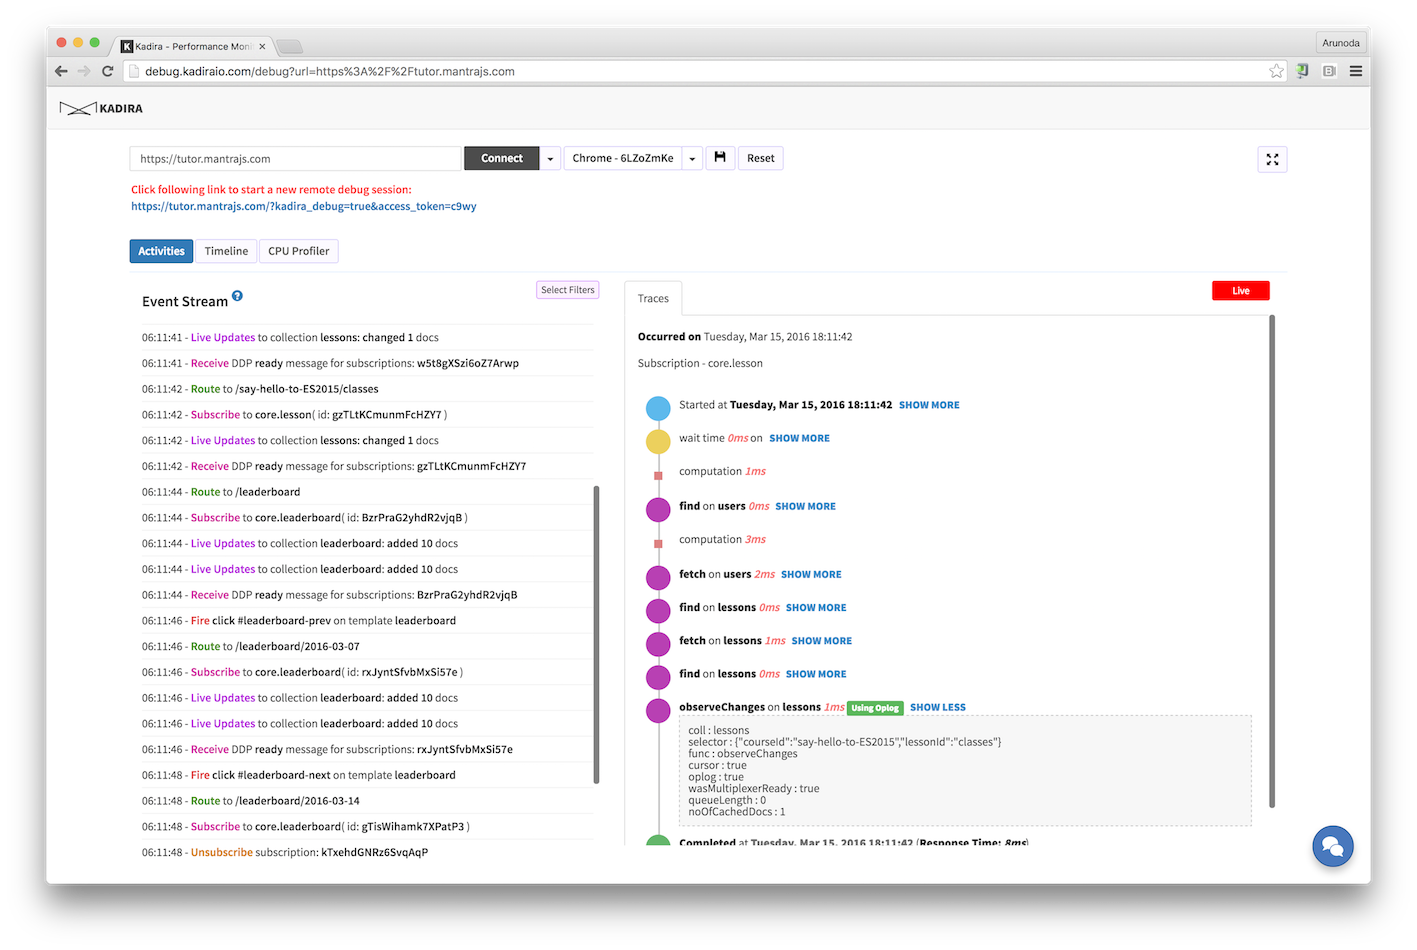
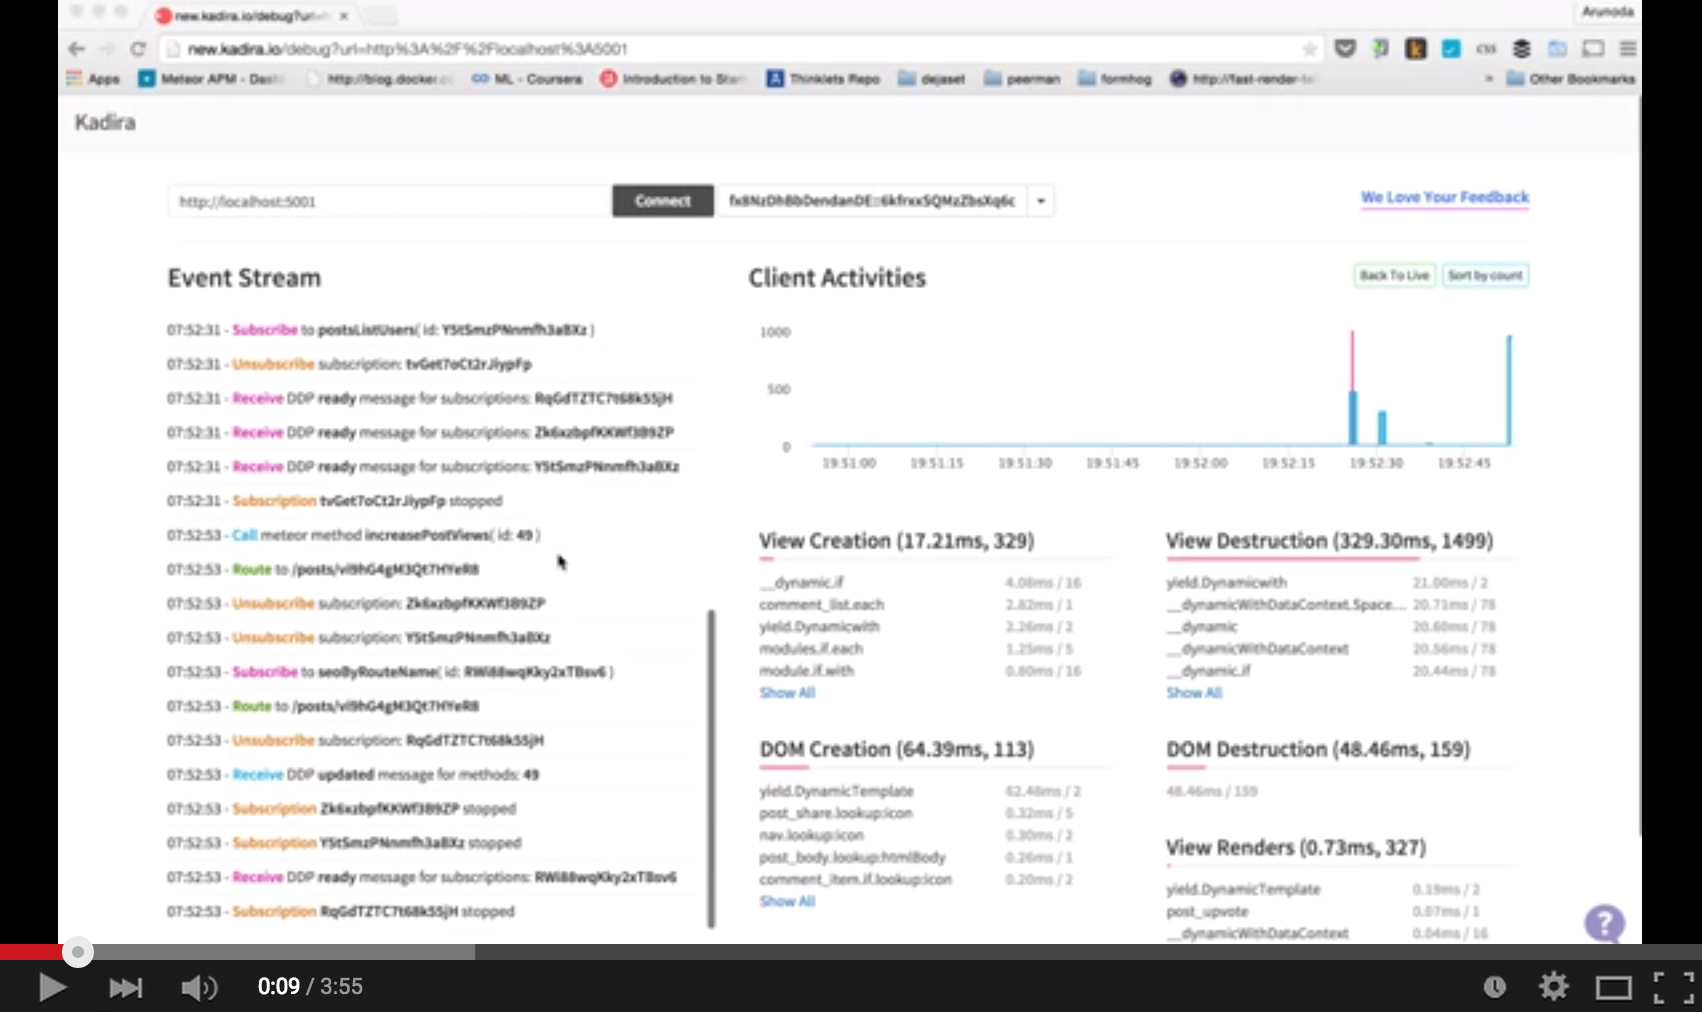
Now, you'll be able to see what's happening in your app as you interact with your app.
If you'd like to learn more about the Monti Debug UI and how to interpret it, watch the following video:
Using With Production Apps
You can even debug your production Meteor app with Monti Debug.
Add a debug auth key to your app
Debug auth key is a key which used to authenticate the Monti debug session. Once you configured, you can enter this key before starting a new Monti debug session on your production app.
You must add this key to your app, otherwise Monti Debug won't work in production.
Adding the debug auth key is simple. You've two options:
- Using Environment Variables
Simply expose following environment variables in your production deployment:
MONTI_DEBUG_AUTH_KEY=<your very long password>
KADIRA_DEBUG_AUTH_KEYis also avaible for backwards compatibility
- Using Meteor Settings
You can also use Meteor Settings to configure the debug auth key. This is how to do it:
1{
2  monti: {
3    debug: {
4      authKey: "<your very long key>"
5    }
6  }
7}
After that, you can use Monti Debug to debug your app and share your debugging session with your teammates.
Note: Sharing works with production apps only.
FAQ
How does it work?
The Monti Debug UI connects directly to your app via DDP. Then it can collect data from both your server and the browser and display it in the Monti Debug management console. If you'd like to learn more, why don't you hack this repo? :)
Does it affect the performance of my app?
Not necessarily. Monti Debug collects, aggregates and sends data in an efficient way. So, it won't add any noticeable overhead to your app. If it does, open an issue. We'd love to fix it.
Is it secure?
Monti Debug simply connects to your app and get information and display it to you. In production, it's protected with a secret key. Monti Debug only connects to apps running on localhost, or are available over HTTPS.
It seems like Monti APM can access all my data. Isn't it?
Nope. The Monti Debug data is stored in two small capped collections (50mb each) in your MongoDB database, and this data won't be sent to Monti APM for any reason. The Monti Debug management console simply connects to your app using DDP so that you can access that data. (Monti Debug management console is a 100% client-side app.)
So, your data remain with your app and Monti APM can't see any of it. You can take a look at this Meteor package for more information.
Is it open source?
Yes and No. Checkout this repo. It's the core of Monti Debug and how we collect data. It's open source under MIT. But, our Monti Debug UI is not open source.
What if I don't have a Monti APM Account?
You don't need to have a Monti APM or Meteor Account to use Monti Debug. But, you should try to create an account :)
Does it work with Nitrous.io or in the cloud development environments?
Yes, it does. In "Nitrous.io", your app runs as a dev app. So, it'll work. Just enter the app URL.
I have a different question
Submit an issue on this repo. If you need to send us a private message, send it to support@montiapm.com.